.jpg)
In California, we’ve counted ourselves among the lucky this past week if the worst we’ve had to cope with is a thick layer of smoke transforming our daytime skies into eerie orange hellscapes. Compared with the trauma of losing a home or loved one, having to evacuate, or having to be rescued by helicopter, daily poor air quality warnings for four weeks straight barely register as a hardship. But for children, elderly adults, people who work outdoors, and other vulnerable groups, smoky days present both immediate and long-term health hazards, such as cardiovascular disease, lung cancer, and premature death.
We built upon data from a 2016 study projecting future “smoke wave” days to better understand where and for whom smoky days will be of increasing concern as climate change pushes wildfires to new extremes.
Recap of the record-shattering 2020 wildfire season so far
Before digging into the data, here’s a quick recap of this year’s explosive western wildfire season to date. There are currently more than 50 major wildfires burning across California, Oregon, and Washington. Wildfires in the three states have burned more than 4 million acres of land—an area larger than the state of Connecticut.
With 2.5 million acres having burned in California alone, this year’s fires have been the most extensive on record for the state. Three of the five largest fires in the state’s history are burning now and all five of those largest fires have occurred in the last three years. The currently-burning August Complex fire sits in the #1 slot for the largest California fire on record with nearly 300,000 acres more burned area than #2 (2018’s Mendocino Complex fire).
In Oregon, wildfires have destroyed five small towns, threatened or forced evacuation for half a million people, encroached on Portland’s suburbs, and caused a record number of wildfire-related deaths for the state.
Tens of millions of people are living with wildfire smoke and all that it brings, from negative health impacts to utter stir craziness. All of this amidst the ongoing COVID-19 pandemic.
Who is most affected by wildfire smoke?
To understand where the frequency of days with wildfire smoke has historically been highest, we turned to a 2016 study published by Jia Coco Liu and colleagues from Yale, Harvard, and other top-notch universities. Their research showed that 370 counties in the western US experienced an average of one or more “smoke wave” days per year between 2004 and 2009.
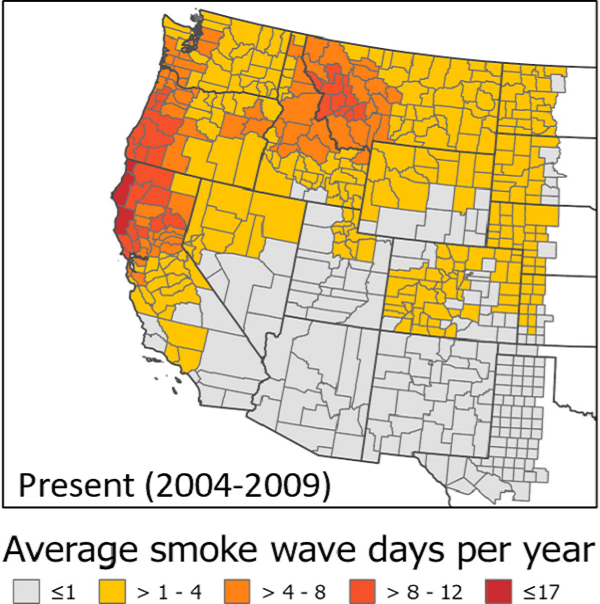
This map shows the average number of smoke wave days–defined as days when the PM2.5 concentration is above the 75th percentile for a given location–per year between 2004 and 2009. The data come from a 2016 study by Liu et al.
For perspective, at least some of these counties—particularly in California—have experienced many more than 17 days of poor air quality from wildfires this year. But for now, let’s take the above map as a basis for exploring who is exposed to wildfire smoke. In the above map you can see that the West Coast north of the San Francisco Bay Area experiences some of the most frequent smoke days, as do northern Idaho and western Montana.
Outdoor workers exposed to wildfire smoke
Among those most exposed to wildfire smoke are people who work outdoors with no option to conduct their work inside. For example, farmworkers in California have, for the most part, continued to harvest the nation’s food and wine despite the clear unsustainability of a food system that relies on exposing people to unhealthy conditions—including many immigrants with limited access to health care and other services. Using data from the Census Bureau’s American Community Survey, we calculated the total number of people engaged in occupations that typically involve a significant amount of time outdoors. These occupations include farming, fishing and forestry, protective service (e.g. firefighters and emergency managers), construction, and several other categories of work.
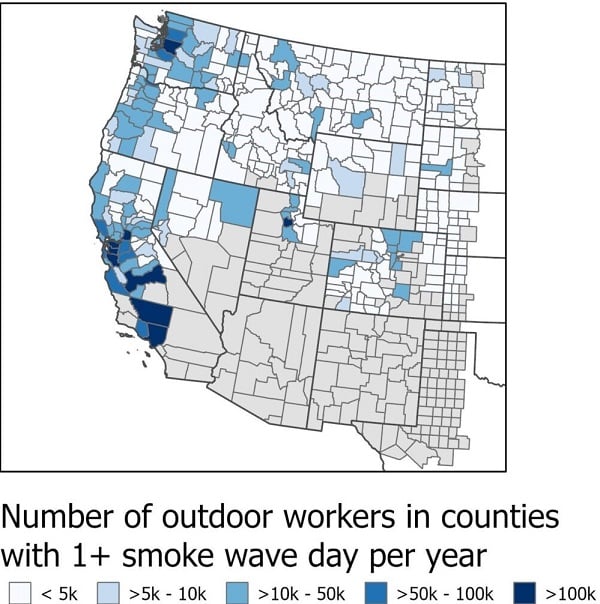
Data from the Census Bureau’s American Community Survey show how many people work in outdoor occupations in counties that presently have one or more smoke wave day per year. Data developed by UCS’s Rachel Licker.
When we look at the number of outdoor workers in counties with at least one smoke wave day per year, we see regions of outdoor work in California’s Central Valley—reflecting the region’s agricultural industry, which produces about one-quarter of our nation’s food supply—as well as in most coastal counties and major cities, such as Seattle and Salt Lake City. All told, there are roughly 4.8 million outdoor workers across the western US who are exposed to wildfire smoke in an average year. About 570,000 of these workers are exposed to the most intense (above 75th percentile for PM2.5) smoke wave days identified by Liu et al.
Seniors and young people exposed to wildfire smoke
Recent studies have shown that long-term exposure to air pollution can exacerbate cardiovascular disease and chronic obstructive pulmonary disorder (COPD), two diseases that affect many elderly people, as well as increase the risk of dementia. Even low levels of exposure to air pollution may, over time, increase mortality risks among elderly people.
In the western US, there are several clusters of counties in which the percentage of people over the age of 65 is higher than the national average, which is 22.5%. Southwestern Oregon, central Idaho, and the northernmost interior counties in California stand out as having relatively large elderly populations that are exposed to high numbers of smoke wave days. All in all, roughly 1 in 8 elderly adults in the US—6.8 million people in total—are exposed to wildfire smoke in an average year.
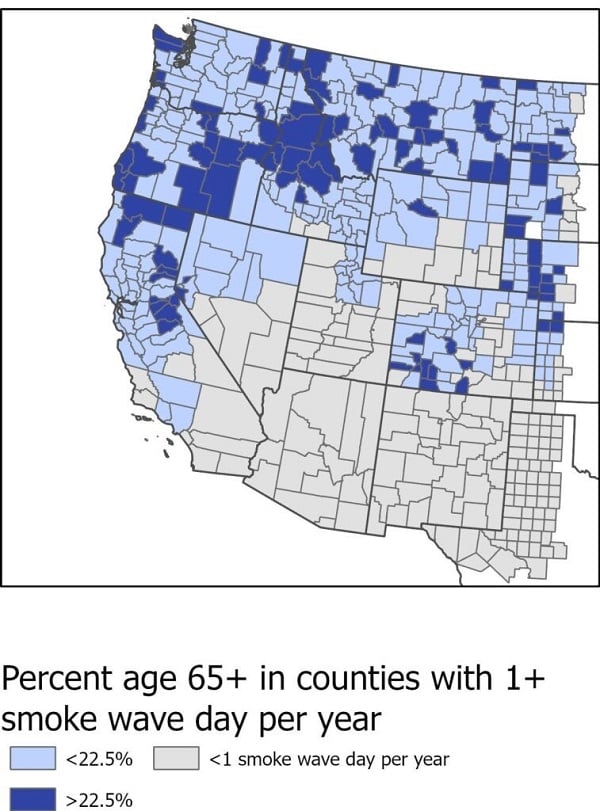
In counties with one or more smoke wave days per year, elderly adults face particular health risks.
Children are also particularly vulnerable to the negative health consequences of smoke exposure, in part because they breathe more rapidly than adults. Roughly 11.1 million children under the age of 17 live in the counties Liu et al. identify as experience one or more smoke wave day per year.
People of color exposed to wildfire smoke
As my colleagues and I have written in many previous posts (like this one and this one), communities of color are disproportionately exposed to air pollution from industrial and vehicle sources. Wildfire smoke adds to the overall pollution burden these communities face. Moreover, Black and Hispanic people in the US have relatively high rates of the sorts of underlying health conditions that can be exacerbated by wildfire smoke—including hypertension and asthma—and relatively low rates of health insurance. These realities are the result of centuries of racist policies that prevented equitable access to things like clean air and preventative health care.
So when wildfire blankets the entire state of California, we Californians don’t all suffer equally. As the map below shows, in about 30% of the counties that regularly experience wildfire smoke, more than 25% of the population identifies as non-White. These counties include clusters on the California coast and the Central Valley as well as in the northern half of Nevada.
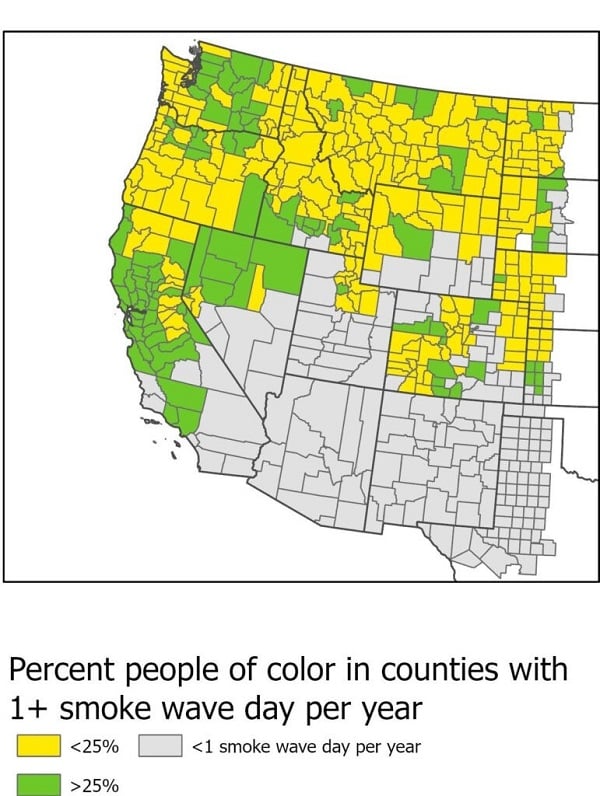
In about 30% of the counties that experience smoke wave days, people of color make up one-quarter or more of the population.
Will climate change make wildfire smoke worse?
Wildfires need fuel, and in the western US that fuel comes in the form of dry vegetation. Studies have shown that climate change is responsible for more than half of the aridification—or drying out—of vegetation that the region has experienced since the 1970s, which has resulted in a doubling of the area that has burned since the mid-1980s. While forest management practices can undoubtedly influence future wildfire trends, we can expect the trend toward increasingly severe fires to continue if heat-trapping emissions continue to rise unchecked. This new web feature developed by my UCS colleagues lays out the connections between climate change and wildfires in a series of photos and charts.
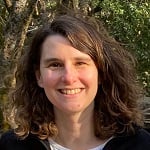
The changing wildfire landscape will, in turn, affect the location, frequency, and intensity of future smoke events. Liu et al.’s study projects, for example, that Idaho and western Montana will see among the largest increases in the frequency of smoke events between now and 2050. Their results also show that smoke wave events in the western US would increase in intensity by an average of about 30%.
In a scenario in which carbon emissions continue to rise through midcentury, Liu et al. project that about 330 counties in the western US would experience an increase in the number of smoke wave days per year between now and 2050.
As I write this final paragraph from my living room in San Francisco, my husband is spending the evening trying to plug any drafts in our nearly 100-year-old home because despite each of us having spent less than 10 minutes outside today to walk the dog, and despite having two air purifiers running at full tilt all day, our throats are sore and our eyes are stinging from the smoke that has worked its way inside. My voice is starting to sound like Selma and Patty’s from the Simpsons, and our kids, whose school buildings remain shuttered, haven’t been outside in days.
Friends and family have asked me when I think life will go back to normal or if this is the new normal. Given what we know about smoke and wildfire trends, the painful truth is that the worst is yet to come.
This blog post was originally published in the Union of Concerned Scientists Blog.
**Photo by Marcus Kauffman on Unsplash
Interested in other articles like this? Subscribe to our bi-weekly newsletter
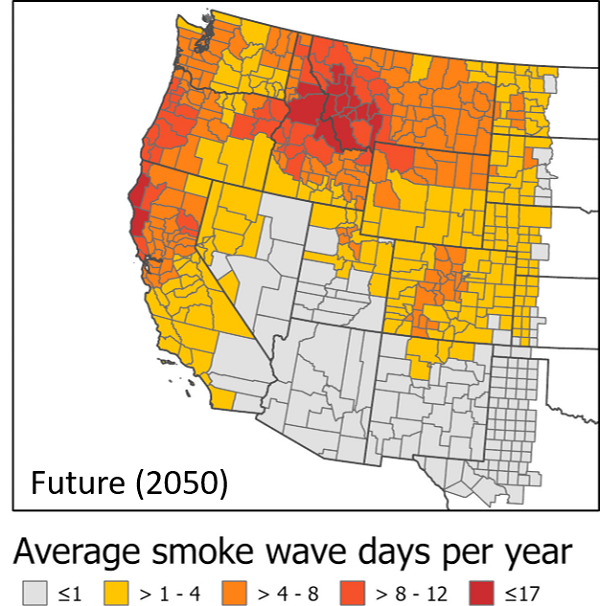
Kristina Dahl, PhD, is a senior climate scientist for the Climate & Energy program at the Union of Concerned Scientists. In her role, she designs, executes, and communicates scientific analyses that make climate change more tangible to the general public and to policymakers. Dr. Dahl earned a PhD in paleoclimate from the MIT/Woods Hole Oceanographic Institution Joint Program and a BA in Earth Sciences from Boston University.


